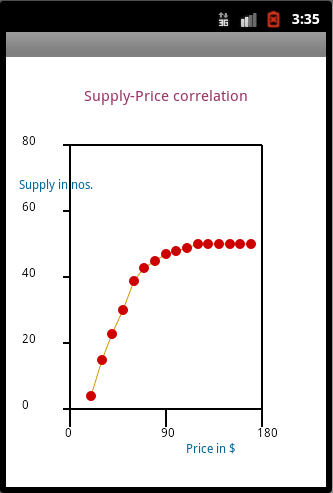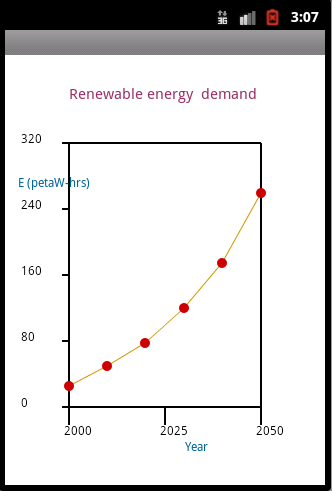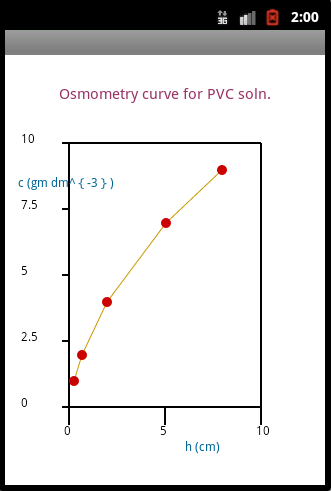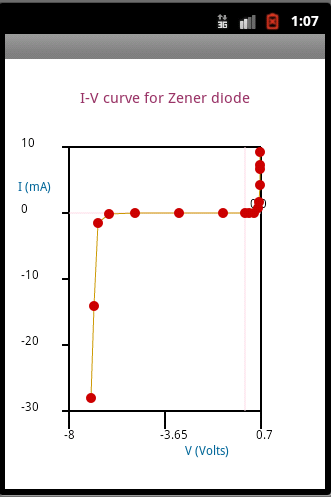


Rajiv had just finished taking readings from the experiment in his Physics Lab when his instructor asked him to plot the data on a graph paper to make sure the readings were correct. There wasn't much time left for the period to end and Rajiv dreaded having to stay longer at school to finish the assignment as he had a football match to watch on TV. How he wished he had a magic wand with which he could have the data plotted in a fly!
Welcome to 2D Data Plotter. It is a simple and free graph plotting app that can be used from inside an android mobile or tab to plot two-dimensional X-Y data very quickly. It should be extremely useful, not only to Rajiv, but to students of all ages and disciplines in schools and colleges and also to anyone wanting to check quickly the behaviour of a set of theoretical or experimental data.
Marketing and sales executives, for example, may find it very useful to present their sales data to their superiors, not only in an elegant pictorial fashion, but also in the shortest possible time.
The app has been tested to run successfully on the latest as well as earlier versions of Android.
New features in the latest updated version:-
Revamped user interface is now more appealing and easier to use.
Axes ranges are now automatically calculated from the input data.
The X-Y graph data is displayed beneath the graph, making it easier to be studied.
Download and install instructions for the latest updated version :-
(i) If you are viewing this page over the internet on your android (ver 2.3.3 or later) mobile phone or tablet, visit my 2D Data Plotter app page in Google Play Store . Press the 'Install' button to automatically download and install the app to your mobile device for free in seconds. If you already have an earlier version of the app installed in your device, you will see an 'Update' button in place of the 'Install' button. Use it to update the app with the latest version.Usage instructions for the latest updated version :-
(i) Start by keeping the default onscreen values in the boxes untouched..press the 'Continue' button on each screen to navigate to the successive screen till you have a plot of the data. This will let you have a feel of how to make the app work for you.Screenshots :-

|

|

|

|
© A. Poddar and M. Poddar : All rights reserved.
A. Poddar
M. Poddar
Dept. of Computer Sc.
Maharaja Manindra Chandra College
20 Ramkanto Bose St. Kolkata India 700003