You may try also out its stripped down version 2d Data Plotter which comes free.
Are you a student pursuing a course in science or engineering? Do you have a hard time recording and analyzing all the data in your lab or practical class? Wouldn’t it be great if you could make the smart phone in your pocket record, plot and analyze the data for you instead? Lab Plot n Fit does just that and more. The Android app can not only help you draw graphs of single and multicolumn 2-dimensional X-Y data with ease, but can also help you fit the data to a number of commonly encountered mathematical functions and any user defined function as well. You can then analyze the data just as you would do in the lab, without however having to use a graph paper or a computer and without having to connect to the Internet.
With the Lab Plot n Fit you can do a whole lot of things like:
Enter your lab data row-wise or alternatively read in your entire data from a text data file (.txt, .dat or .csv) generated from MS Excel or other software programs and stored in your device's memory beforehand.
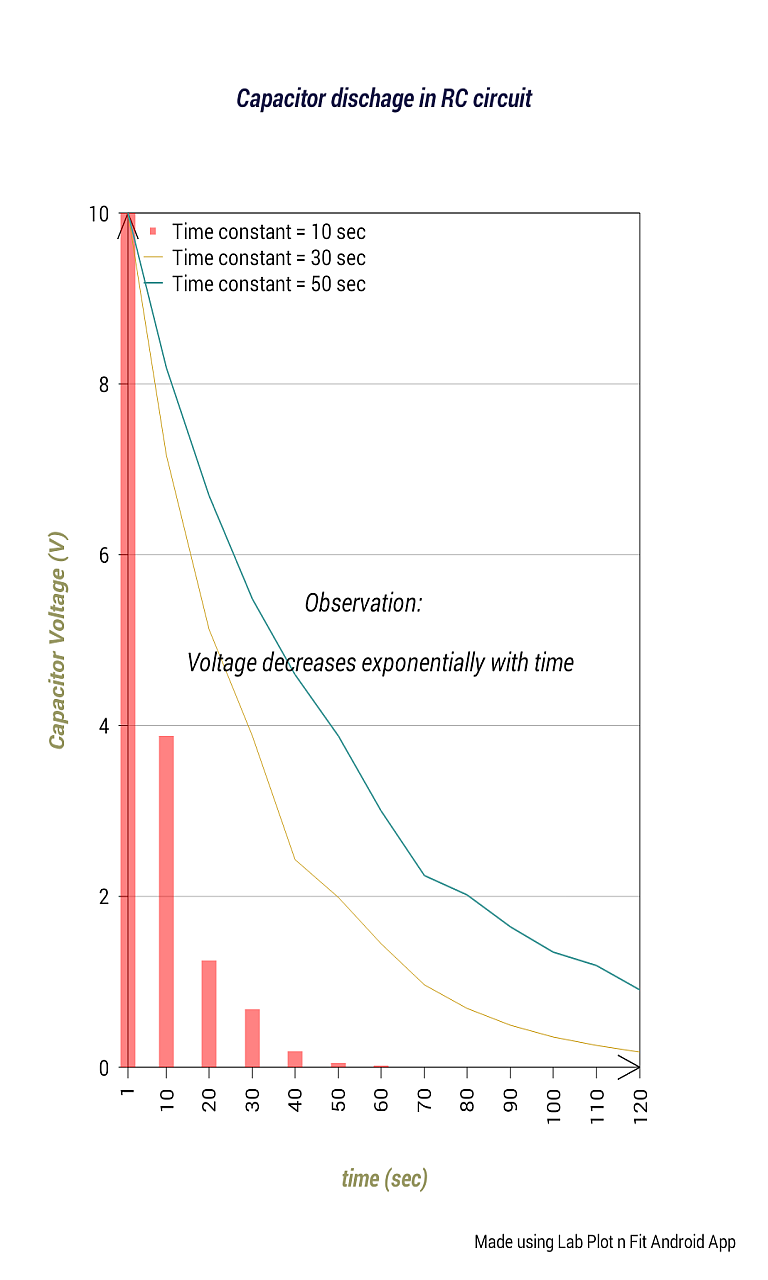
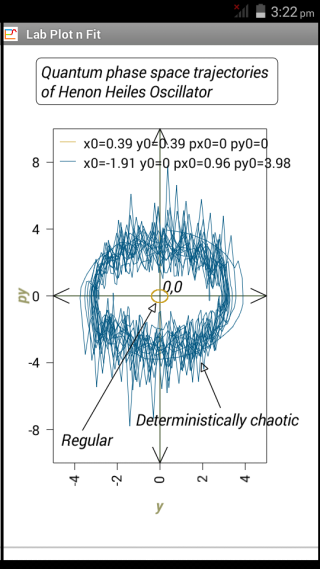
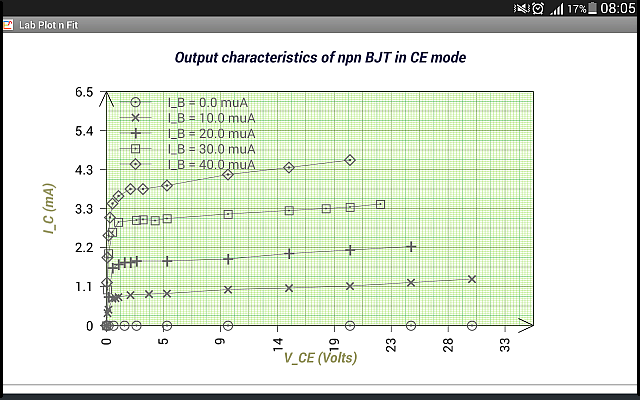
Plot graphs of one or more number of data-sets by using a simple interface. Generate grids of different resolutions mimicking a conventional graph paper.
Change axes ranges, change axes types, stretch or shrink the axes or shift the origin.
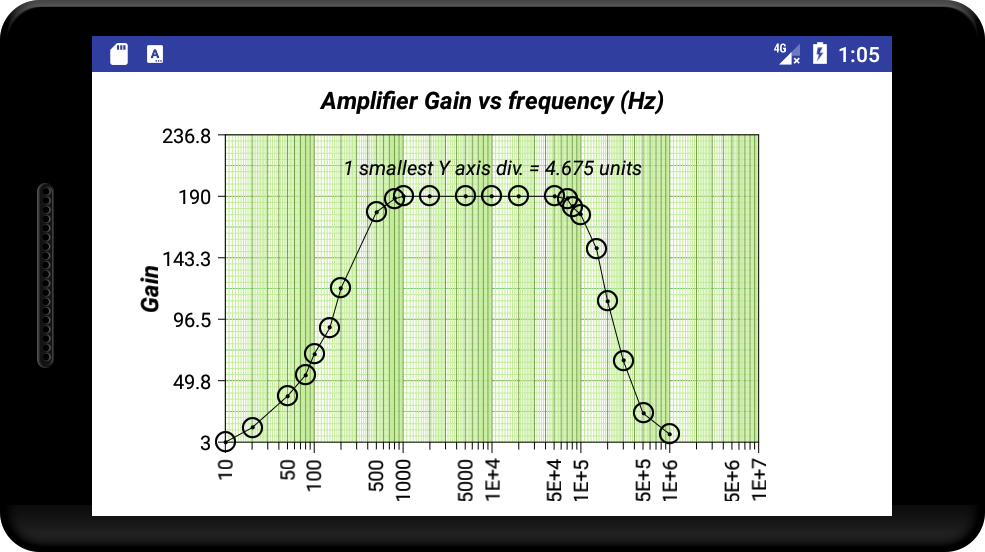
Scale your axes to generate semi-log and even log-log graphs.
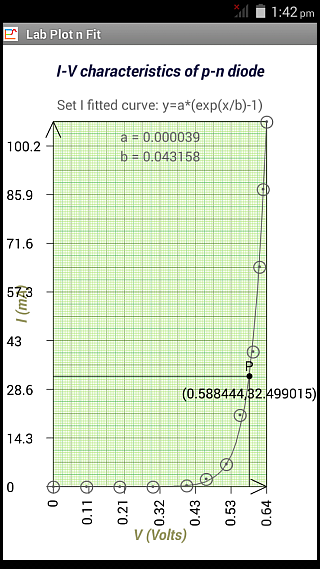
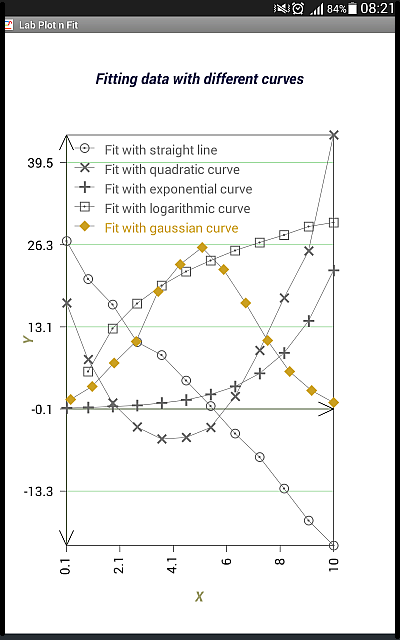
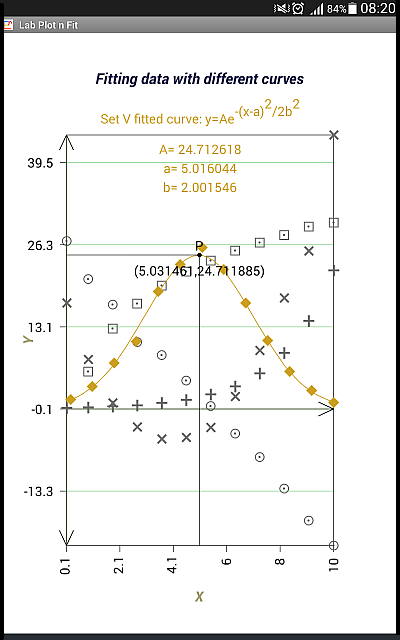
Fit the whole or a portion of the graph for each data set to common mathematical functions and also to any user defined function , also using a simple interface.
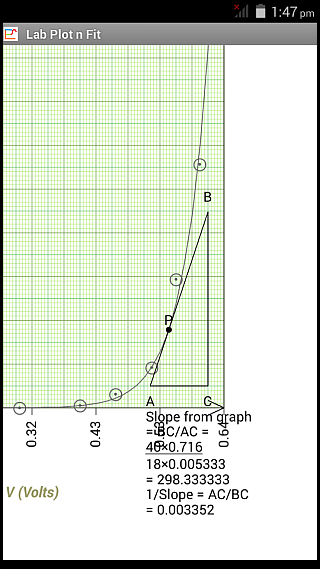
Once the plotting and fitting is done, double tap on any point on the fitted curve to observe and display the corresponding X-Y point. Perform a slope calculation at that point by drawing a tangent and a right-angled triangle, just as you would do using a conventional graph paper. Also obtain Y value(s) at any X value and X value(s) at any Y value from the fitted curve.
Save both the data as well as high resolution images of your displayed graph, both before and after fitting, to the device's memory.
Retrieve the saved data at a later time by importing the saved data file into the app and then edit, plot and fit the data again.
Add info like, your name, instructor's or teaching assistant's name, the name of the experiment the graph pertains to, and so on, to your graph image and data and send them as part of your lab assignment to your teacher or supervisor via email, from right inside the app itself.
And more.
We are confident you would find the app very useful..so go ahead and purchase it. In case you are not satisfied, you may uninstall it within 48 hours to receive a full refund (check Google Play refund policy for the exact and current rules on refunds).
A few screenshots of the app are presented below :-
|
|
|
|
|
|
|
|
|
|
|
© Authors: A. Poddar and M. Poddar
abhimon.apps@gmail.com
A. Poddar
Dept. of Electronic Sc.
Surendranath Evening College
24/2 M.G. Rd. Kolkata India 700009
blog site: www.abhipod.com
M. Poddar
Dept. of Computer Sc.
Maharaja Manindra Chandra College
20 Ramkanto Bose St. Kolkata India 700003